Share this
by PowerShield on Jan 14, 2020 8:53:30 AM
Introduction
This article will explain how the connection method between impedance measurement device and the battery affect the impedance reading.
As mentioned in the first article, there are a number of factors that can influence an impedance measurement. Comparing results without understanding these factors will lead to misinterpretation.
For example, trying to compare readings where the connection between the battery and measurement device uses two battery posts versus four battery posts is not possible, which we will explain.
In order to understand the different ohmic readings, an understanding is required of a 4-wire connection, also known as a kelvin connection, and we’ll look at this too.
Battery Impedance Size
Lead-acid batteries have a low impedance, therefore the ability to deliver high currents. Hence the large, short circuit current specified on battery datasheets, e.g., 2,500A for 12V 80 Ah battery.
Typical impedance for a battery in the standby industry:
- 12V 80Ah VRLA battery = 0.003 Ω (3.0mΩ)
- 2V 800Ah VRLA battery = 0.0002 Ω (0.2mΩ)
To get an idea of the size of impedance, let’s compare the typical battery impedances to the resistance of the wire in a standard IEC power lead. The wire length equivalents of the impedances mentioned are 330mm (13.0 inches) and 22mm (0.87inches).
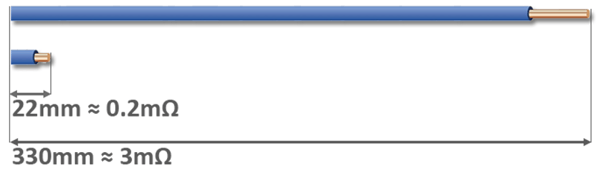
As you can see, the impedance of a battery is small, which makes it more difficult to measure and it is easy for errors to be introduced into the measurement.
Measurements
The following equipment has been used to produce the results.
- Hioki BT3554-01 battery tester
- 2 x 2V 400Ah VRLA AGM batteries
- 16 x tin plated brass battery tags
A number of measurements have been taken with different types of connections between the battery tester and the battery, and the results are below.
| # | Connection | Battery A | Battery B | |
| 1 |
|
1223 | 1179 | µΩ |
| 2 |
|
|
598 | µΩ |
| 3 |
|
|
554 | µΩ |
| 4 |
|
|
564 | µΩ |
| 5 |
|
|
194 | µΩ |
Photos and details of the connections are outlined near the end of the article.
As you can see the readings have a wide range for the same battery depending on the connection method used.
4-wire Connection
To take a battery impedance measurement, a test signal is applied to the battery and its voltage response measured.
But we know from the IEC power lead wire info that the resistance of the test harness is in a similar range to the battery impedance, as the cable between the battery and measurement device may be 500mm to 1000mm (19.7 inches to 39.4inches).
For example:
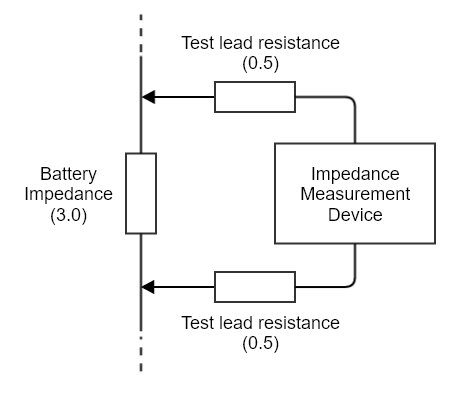
The total test lead resistance is 1.0 mΩ and the battery impedance is 3.0 mΩ. The error introduced by the test lead resistance is substantial in proportion to the battery; ideally, the test lead resistance would be 0 mΩ so that it would not have any impact, but that is not possible. Therefore, to accurately measure a low resistance or low impedance, a measurement technique is required that mitigates the test lead resistance. This can be achieved by using a 4-wire connection, also known as a Kelvin connection.
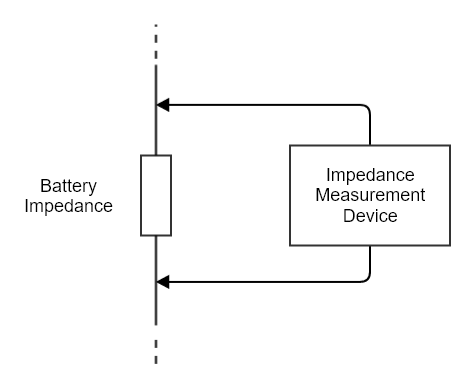
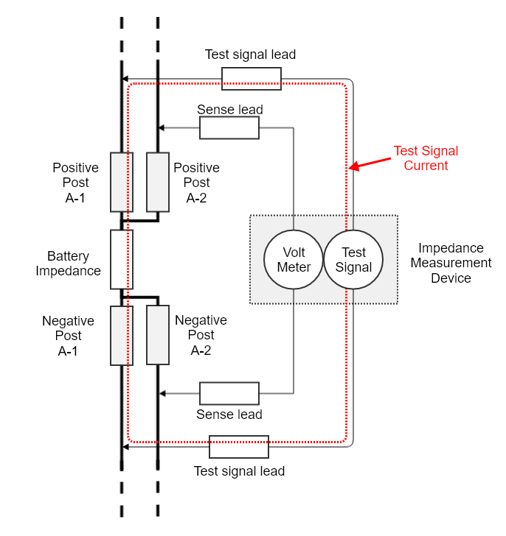
Below is a diagram of all the key components of an impedance measurement device connected to a battery with a 4-wire connection.
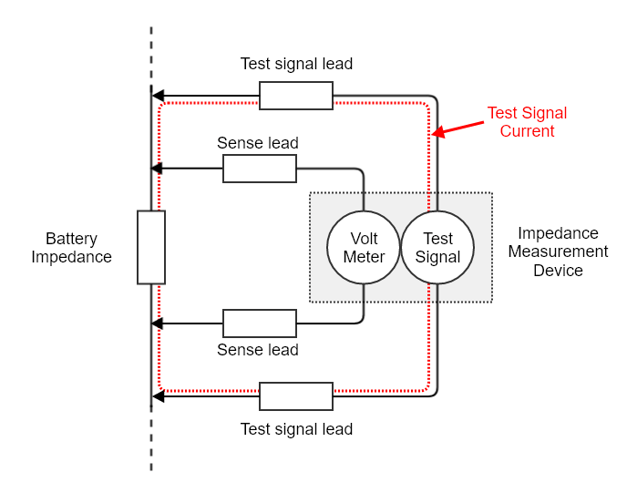
From the above diagram, you can see that the test signal and sense signal circuits are separated. The test signal current only flows through the test signal leads and the battery. As a result of the separation, the test signal lead resistance is eliminated from impacting the measurement.
The sense circuit has a tiny current flowing and, in this case, can be approximated to zero. As there is no current flowing, there is no voltage drop across the sense lead resistance (Ohms law; voltage = resistance x current) so the voltmeter is reading the voltage across the battery impedance only (Battery impedance x test signal current). Therefore, the impact of the sense lead resistance has been eliminated.
As you can see, the 4-wire technique allows for resistance in the test harness without impacting the accuracy of the measurement. This technique is not unique to the battery measurement industry and is widely used by other instruments.
Additional Resistance
The battery readings taken with the different types of connections have a wide range of values even though it is the same battery.
- Battery A: 186 µΩ to 1223 µΩ
- Battery B: 194 µΩ to 1179 µΩ
The range in values is due to the different connections between the meter and the battery. The truest reading is with the four-post connection; the worst is when the test probe is on the bolt.
Below is an electrical model that shows the introduction of additional resistance that is in the path, such as the bolt, washer/tag, battery post etc.
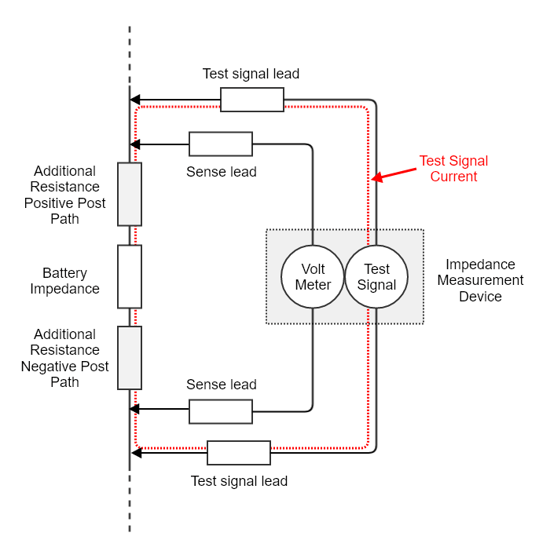
When additional resistance is introduced into the sense circuit loop which has the test signal current flowing through it, the additional resistance becomes part of the measurement and hence the higher reading.
Handheld vs Permanent
The truest reading result was the 4-wire connection using the four posts of the battery. This type of connection can be achieved with a permanent monitor but is not very practical for a handheld instrument.
The probes for a handheld instrument may produce a kelvin connection if using a multi-point approach, but the distance between the sense and signal point is small and fixed, so a connection to four battery posts is not possible.
An example of a Kelvin (4 wire) connection probe is below.
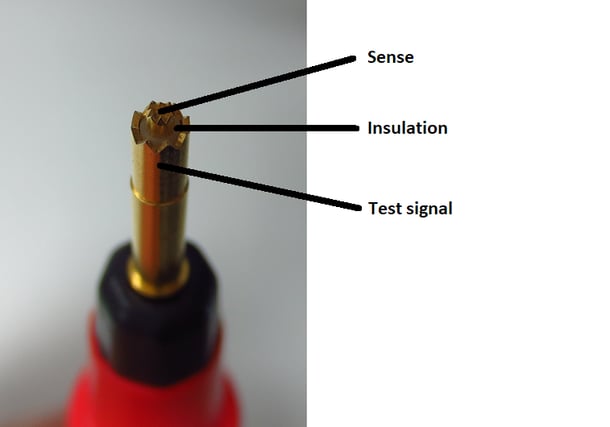
In the above picture, you can see the probe has an outer connection, then insulation and an inner connection. So, the test signal and sense circuits are separated.
The Hioki battery tester provides access to the sense and test signal connections which allows for different harness types to be connected instead of the standard test probes. Because the connections are accessible the Hioki can be connected to all four battery posts as per connection type #5 with a different wire harness. This is only practical in a laboratory environment and is not feasible or safe at a real installation.
Connection Details
| # | Connection | Battery A | Battery B | Details |
| 1 |
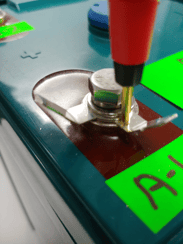
Probe on bolt connection
|
1223 | 1179 |
The bolt has significant resistance and this resistance becomes part of the sense circuit because the test signal current flows through the bolt. |
| 2 |
Probe on battery tag
|
640 | 598 |
This connection is an improvement compared to #1. However, the resistance of the battery tags are part of the measurement. |
| 3 |
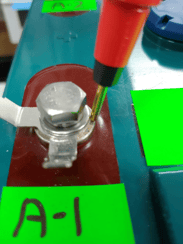
Probe on post
|
560 | 554 |
This is the lowest reading with the handheld tester probes, and this location has eliminated the bolt and battery washer resistances. This is not a feasible connection type for permanent battery monitors. |
All readings in the table above are in micro ohms.
#4 Two post and four tag connection
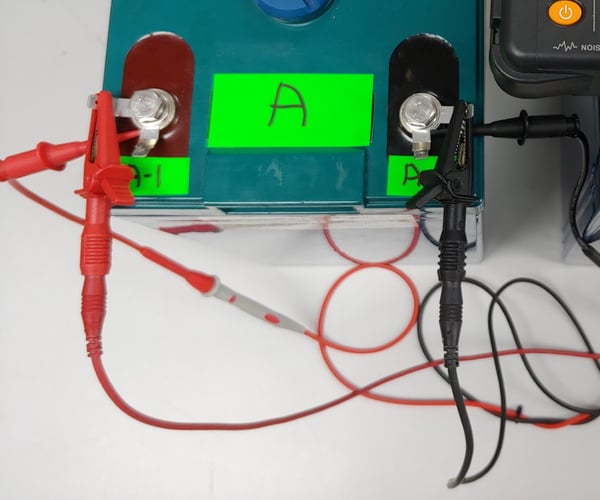
Battery A 569 µΩ and Battery B 564 µΩ. The test signal is applied via the large crocodile clips in the photo and the sense signal are the smaller clips, both signals are connected using the battery tags.
This result is very similar to connection 3 result and provides comparable values between a handheld probe connection and a permanent battery monitor style connection. Thus, this is the recommended connection points if comparing a handheld measurement to a permanent system measurement in the field.
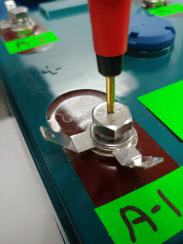
#5 Four post and four tag connection
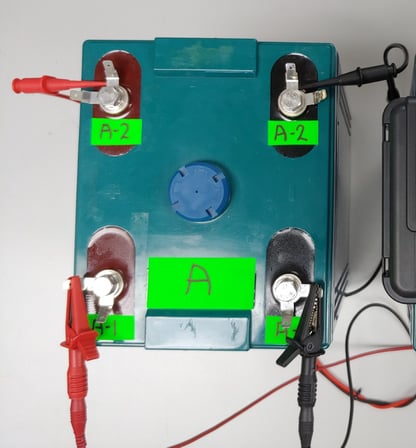
Battery A 186 µΩ and battery B 194 µΩ. The test signal is applied via the large crocodile clips on the A-1 battery posts and the sense signal are connected to the A-2 battery posts, both signals are connected using the battery tags.
This connection provides the lowest and truest reading for the battery as the sense circuit has no additional resistance introduced but this style of connection is only practical for permanent battery monitor systems.
Below is an electrical model of the four-post connection and in the model, you can see that the test signal current does not flow in the A-2 path, so the additional resistance in the A-1 and A-2 path have no impact on the impedance measurement.
 Summary
From the measurements, it can be seen that probe location is very important as it has a large influence on the reading.
The reading value is also very dependent on the type of connection. On a multi-post battery, the value measured is dependent on the number of posts used in the measurement.
It is not feasible to compare a handheld instrument using two posts on the battery versus a permanent battery monitor using four posts on the battery, even if they are using the same test signal/method.
Care and understanding needs to be applied when comparing impedance measurements taken.
For further insights into the topic of impedance measurement, explore the other articles in the series:
Battery Internal Ohmic Measurements Explained – Part 1 (Impedance)
Battery Internal Ohmic Measurements Explained – Part 3 (Importance of Context)
Share this
Battery Internal Ohmic Measurements Explained - Part 1 (Impedance)
Failure modes in lead-acid batteries