Share this
by PowerShield on Jun 15, 2018 3:35:41 PM
In our previous blog, we introduced PowerShield8 and its accompanying Link battery management software. We emphasised the importance of installing the software that comes with your battery management system (BMS), and this is especially true of Link software. Not only does it allow comprehensive monitoring from a single control point, but it gives you a powerful, graphical interface to the batteries.
All too often, what we’ve found is that when the system is installed, that software is ignored. It’s an important feature that needs to be installed and used to effectively monitor the status and performance of your batteries. While a typical data center manager is extremely busy and another dashboard can seem like an imposition, using Link software really maximises the value of your investment in a BMS.
Link software’s dashboard displays the status of all your batteries on one page – and that’s all your sites and systems, not just one. Think of it as a ‘homepage’ for all your batteries.
Traffic light dashboard
This screen allows you to view the status of all your batteries at a glance. Green for good, orange for warnings and red for critical issues. Clicking on them takes you directly to the Real Time Detail screen so you can view the key data.
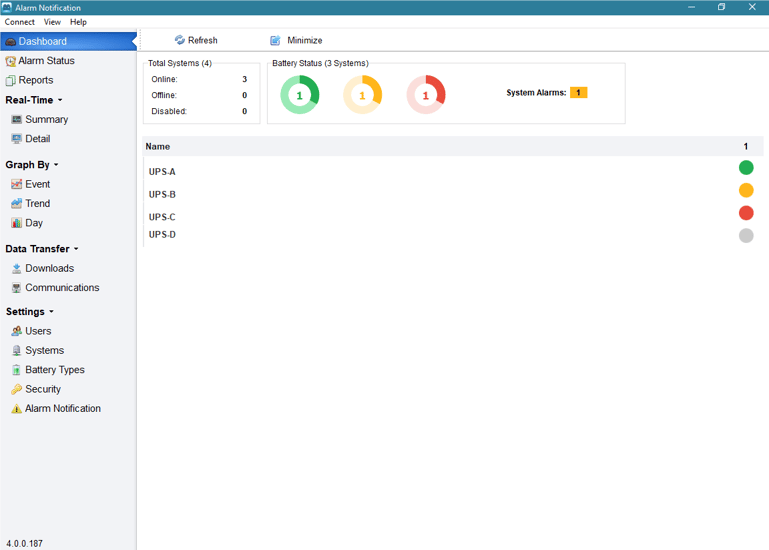
The traffic lights are designed to quickly grab your attention, allowing you to take a more proactive approach to your BMS. Instead of just glancing at the screen and moving on, you can drill down into each indicator to further investigate what an orange or a red indicator means. This gives you a head start for any issues that might be cropping up. You’ve heard the old saying “it’s better to prevent fires than it is to fight them”, and that applies with your BMS. With the albeit low risk of thermal runaway in a battery, this can be a literal not just figurative threat!
Our next blog will go into more detail about analysing the history and trends of your BMS data.
Real-time screens
Having checked out your traffic lights and noted some orange or red indicators, you can then click on them and get more detail about the issue. You’ll see the latest measurements for individual battery voltage, ohmic value and temperature.
This will give you some clues as to how your batteries are behaving when you’re not looking. And it’s why you should make a habit of periodically clicking on green indicators as well as the red and orange, because a green indicator doesn’t necessarily mean it’s always been good. That’s the purpose of the Alarms screen.
Alarms screen
This shows you a list of all active battery alarms across all systems connected to Link. You can use it to view archived alarms to get a better understanding of battery behaviour.
The PowerShield8 Controller automatically clears alarms, when the alarm condition no longer exists. These alarms are automatically archived in the Link software. There may be no alarms present on the monitor when you’re currently looking at it, but it’s a good idea to check the archive to get a better understanding of battery behaviour in your facility.
For example, there might have been a spike in temperature at midnight for the past 3 or 4 nights, but has resolved by 8am which is when you’re probably looking at the dashboard. Again – this is about taking a proactive, ‘fire’ prevention, approach to your BMS, and the Link software will help you to do just that.
Our next blog will focus on how Link battery management software can help you get the most out of your BMS data by analysing historical behaviour and the life trends of your batteries.
If you have any questions about PowerShield8 and Link battery management software, don’t hesitate to contact us. You can also sign up for our newsletter here.
Share this

Turning data into actionable insights - the missing link
UPS battery monitoring enters new era